

The Complete Guide to Quality Monitoring in Customer Support [2025]
What is Quality Monitoring?
Definition
Quality monitoring is the systematic process of evaluating customer service interactions to ensure they meet established standards, identify improvement opportunities, and drive continuous enhancement of the customer experience.
At its core, quality monitoring answers three fundamental questions:
- Are we delivering the experience we promise?
- Where are we falling short?
- How can we improve?
The Purpose of Quality Monitoring
Quality monitoring serves multiple critical purposes:
1. Performance Measurement
Objective assessment of how well agents handle customer interactions based on defined criteria.
2. Coaching & Development
Identification of specific areas where agents need training or support to improve their performance.
3. Customer Experience Optimization
Understanding what drives satisfaction (or dissatisfaction) to make data-driven improvements.
4. Compliance & Risk Management
Ensuring interactions meet legal, regulatory, and company policy requirements.
5. Process Improvement
Identifying systemic issues in workflows, scripts, or policies that hinder excellent service.
6. Recognition & Motivation
Highlighting exceptional performance to celebrate, reward, and replicate excellence.
What Quality Monitoring Is NOT
To clarify misconceptions:
❌ NOT surveillance or "Big Brother" - When done right, QM is about development, not punishment
❌ NOT just for call centers - Applies to all customer interaction channels
❌ NOT only about metrics - Qualitative insights matter as much as quantitative scores
❌ NOT a one-time audit - It's an ongoing, continuous process
❌ NOT punitive - The goal is improvement, not blame
Quality Monitoring vs. Quality Assurance
While often used interchangeably, there's a subtle distinction:

In practice, most organizations blend both approaches under a unified quality program.
The Quality Monitoring Ecosystem
Effective quality monitoring doesn't exist in isolation. It connects to:
- Customer Satisfaction (CSAT/NPS): Quality scores should predict satisfaction
- Agent Performance Management: Quality data informs evaluations and development
- Training Programs: Insights drive curriculum development
- Product/Service Improvements: Feedback reveals product issues
- Company Strategy: Quality trends inform strategic decisions
The Evolution of Quality Monitoring
Understanding where quality monitoring has been helps us appreciate where it's going.
Era 1: The Clipboard Days (1960s-1980s)
The Method:
- Supervisors physically sat next to agents
- Handwritten notes on paper forms
- Gut-feel evaluations based on impressions
Characteristics:
- ✅ Direct observation
- ✅ Immediate feedback possible
- ❌ No scalability
- ❌ Extremely subjective
- ❌ High supervisor time cost
Coverage: <1% of interactions
Era 2: Call Recording & Sampling (1990s-2000s)
The Method:
- Calls recorded to tapes, then digital files
- Random sampling of 2-5% of calls
- Structured scorecards emerged
- Dedicated QA teams formed
Characteristics:
- ✅ Some objectivity through scorecards
- ✅ Ability to review interactions multiple times
- ✅ Standardized evaluation criteria
- ❌ Still limited sampling
- ❌ Time-intensive manual review
- ❌ Selection bias
Coverage: 2-5% of interactions
Key Innovation: The structured scorecard brought some consistency to evaluations.
Era 3: Quality Management Software (2010-2020)
The Method:
- Dedicated QM software platforms
- Automated call recording
- Random sampling algorithms
- Calibration sessions
- Reporting dashboards
Characteristics:
- ✅ Better workflow management
- ✅ Easier reporting and analytics
- ✅ Some automation of logistics
- ✅ Multi-channel support (email, chat)
- ❌ Still reliant on sampling
- ❌ Manual evaluation bottleneck
- ❌ Significant QA team required
Coverage: 2-10% of interactions
Key Innovation: Software made the sampling process more efficient, but didn't solve the fundamental sampling limitation.
Era 4: AI-Powered Quality Monitoring (2020-Present)
The Method:
- Natural Language Processing (NLP)
- Automatic Speech Recognition (ASR)
- Sentiment analysis
- AI-driven evaluation
- Custom criteria via prompts
- Real-time analysis
Characteristics:
- ✅ 100% interaction coverage
- ✅ Instant feedback possible
- ✅ Consistent evaluation criteria
- ✅ Pattern detection across large datasets
- ✅ Reduced QA team size needs
- ✅ Multi-language support
- ⚠️ Requires quality training data
- ⚠️ Technology investment needed
Coverage: 100% of interactions
Key Innovation: AI removes the sampling constraint entirely, making comprehensive quality monitoring economically viable.
The Paradigm Shift
The evolution from Era 3 to Era 4 represents a fundamental paradigm shift, not just incremental improvement:
Old Paradigm (Sampling-Based):
- "We can only afford to check a small sample"
- Quality is an expense center
- Delayed feedback (days or weeks)
- Limited to dedicated QA team insights
New Paradigm (Comprehensive AI):
- "We analyze every interaction automatically"
- Quality drives revenue through satisfaction
- Real-time or near-real-time feedback
- Every stakeholder has quality insights
This shift is as significant as the move from manual accounting to spreadsheets—it changes what's possible.
Why Traditional Quality Monitoring Fails
Despite good intentions, traditional quality monitoring approaches have fundamental flaws that limit their effectiveness.
Problem 1: The 2% Sampling Trap
The Issue:Most organizations evaluate 2-5% of customer interactions due to the time and cost constraints of manual review.
Why It Fails:
- Statistical irrelevance: 2% sample rarely represents the full population
- Selection bias: Random isn't truly random when humans select calls
- Blind spots: 98% of interactions are never seen
- Gaming: Agents know most calls won't be reviewed
- Missed patterns: Rare but critical issues go undetected
Real Impact:A telecom company discovered through 100% AI analysis that their "top performer" (based on 2% sampling) was actually creating the most customer dissatisfaction—they closed tickets fast by not actually solving problems.
Problem 2: The Time Lag Problem
The Issue:Manual review creates delays of days or weeks between interaction and feedback.
Why It Fails:
- Memory decay: Agents forget the context
- Missed coaching moments: Issues become habits
- Delayed correction: Poor practices continue unchecked
- Frustrated customers: Problems aren't caught in time
By the Numbers:
- Average time from interaction to quality review: 11 days
- Agent memory retention after 2 weeks: <30%
- Coaching effectiveness after 1 week vs. immediate: -65%
Problem 3: Evaluator Inconsistency
The Issue:Different evaluators interpret criteria differently, creating subjective, inconsistent scoring.
Why It Fails:
- Rater bias: Personal preferences influence scores
- Halo/horn effect: One aspect colors entire evaluation
- Drift: Standards change over time
- Calibration burden: Constant effort needed for alignment
Example:One company found 40-point score differences when the same calls were evaluated by different QA team members.
Problem 4: The Cost-Quality Tradeoff
The Issue:Expanding quality monitoring requires proportional increases in QA team size.
The Math:
- Average time to evaluate one interaction: 8-12 minutes
- One QA analyst capacity: ~40-50 evaluations/day
- To evaluate 10% of 10,000 daily interactions: 20-25 full-time QA analysts
- Annual cost: $800K-$1.2M+
For many organizations, comprehensive quality monitoring simply isn't economically viable with manual methods.
Problem 5: Channel Fragmentation
The Issue:Customers interact across phone, email, chat, social media, and messaging apps—but quality monitoring often covers only phone.
Why It Fails:
- Incomplete picture: Phone-only QM misses 60-70% of interactions
- Channel inconsistency: Quality varies wildly across channels
- Resource constraints: Can't hire enough QA for every channel
- Different skill requirements: Evaluating chat differs from evaluating calls
Problem 6: Reactive, Not Proactive
The Issue:Traditional QM finds problems after they've already impacted customers.
Why It Fails:
- Damage done: Customer already had poor experience
- Missed prevention: Could have intervened in real-time
- Complaint escalation: Issues snowball before detection
- Churn risk: Customer may leave before problem identified
Problem 7: Limited Actionability
The Issue:Quality scores without deeper insights don't tell you what to fix or how to improve.
Why It Fails:
- Generic feedback: "Improve empathy" isn't actionable
- No pattern detection: Can't identify systemic issues
- Coaching guesswork: Don't know which training to prioritize
- ROI uncertainty: Can't prove quality impact on business outcomes
The Cumulative Effect
These problems compound:
Scenario: A support team using 2% sampling with 2-week feedback lag...
- Evaluates only 2% of interactions
- Provides feedback 2 weeks late (when agent barely remembers)
- With inconsistent scoring (different evaluators, different standards)
- At high cost ($50K+ per QA analyst)
- For phone only (ignoring 60% of customer interactions)
- Reactively (after customer impact)
- With generic insights ("be more empathetic")
Result: Expensive, slow, inconsistent, incomplete quality monitoring that frustrates everyone and improves little.
The Business Case for Quality Monitoring
Quality monitoring isn't just "nice to have"—it's a strategic investment with measurable ROI.
The Cost of Poor Quality
Before exploring quality monitoring benefits, let's quantify what poor quality costs:
1. Customer Churn
- Industry average churn from poor service: 67% of customers
- Cost to acquire new customer vs. retain existing: 5-25x higher
- Lifetime value of lost customer: $2,000-$50,000+ (depending on industry)
Example Calculation:
- 100 customers churn annually due to poor service quality
- Average customer lifetime value: $10,000
- Annual cost of poor quality: $1,000,000
2. Negative Word-of-Mouth
- Customers with poor experiences tell: 15 people on average
- Negative reviews impact: 22% of potential customers deterred per bad review
- Cost per negative review: $300-$2,500 in lost revenue
3. Repeat Contacts
- Percentage of contacts requiring follow-up due to poor resolution: 30-40%
- Cost per additional contact: $5-$50
- Annual cost for 100,000 contacts with 35% repeat rate: $175,000-$1,750,000
4. Employee Turnover
- Support agent annual turnover: 30-45% industry average
- Cost to replace one agent: $15,000-$25,000
- For a 100-agent team at 35% turnover: $525,000-$875,000 annually
Total Cost of Poor Quality Example:For a mid-sized company:
- Customer churn: $1,000,000
- Negative reviews: $150,000
- Repeat contacts: $500,000
- Employee turnover: $700,000
- Total: $2,350,000 annually
The ROI of Quality Monitoring
Now let's examine the returns from investing in quality monitoring:
1. Improved Customer Satisfaction
Impact:
- Average CSAT improvement with quality program: +15-25%
- NPS improvement: +10-18 points
- Customer retention improvement: +5-12%
Value:
- 10% retention improvement on $10M revenue: $1,000,000 annual value
- Reduced churn saves: $400,000-$800,000 (from above example)
2. Increased Efficiency
Impact:
- First Contact Resolution (FCR) improvement: +10-20%
- Average Handle Time (AHT) reduction: -5-15% (through better quality)
- Repeat contact reduction: -20-35%
Value:
- 20% reduction in repeat contacts: $100,000-$350,000 saved
- 10% FCR improvement: $150,000-$400,000 in efficiency gains
3. Reduced Agent Turnover
Impact:
- Agent turnover reduction with quality coaching: -20-35%
- Employee engagement improvement: +25-40%
Value:
- 25% turnover reduction (from 35% to 26.25%): $131,000-$218,000 saved
4. Time Savings for Managers
Impact:
- Manager time spent on manual quality reviews: 10-15 hours/week
- Time saved with AI automation: 80-95%
Value:
- 5 managers saving 12 hours/week each: 3,120 hours/year
- At $50/hour loaded cost: $156,000 annual value
- Reallocated to coaching: Priceless
5. Revenue Growth
Impact:
- Upsell/cross-sell improvement from quality interactions: +15-30%
- Customer lifetime value increase: +20-35%
Value:
- 25% CLV increase on $10M customer base: $2,500,000
Sample ROI Calculation
Company Profile:
- 100 support agents
- 10,000 monthly customer interactions
- Current quality monitoring: 2% manual sampling
- 3 full-time QA analysts
Investment:
- AI Quality Monitoring platform: $60,000/year
- Implementation & training: $15,000 one-time
- Total Year 1: $75,000
Returns (Conservative Estimates):
- Reduced churn (5% retention improvement): +$500,000
- Efficiency gains (15% repeat contact reduction): +$200,000
- Turnover reduction (25% improvement): +$150,000
- Manager time savings: +$150,000
- Total Annual Benefit: $1,000,000
ROI: 1,233% in Year 1
Payback Period: <1 month
Non-Financial Benefits
Beyond dollars, quality monitoring delivers:
- ✅ Better decision-making: Data-driven insights replace gut feelings
- ✅ Competitive advantage: Consistently better experience than competitors
- ✅ Brand reputation: Fewer negative reviews, more positive mentions
- ✅ Compliance assurance: Proof of regulatory adherence
- ✅ Innovation insights: Customer feedback drives product improvements
- ✅ Cultural shift: Quality becomes everyone's responsibility
The Cost of NOT Monitoring Quality
Perhaps most compelling is the inverse: what happens if you don't invest in quality monitoring?
Without Quality Monitoring:
- No visibility into 98%+ of customer interactions
- Poor performers go unidentified
- Training is guesswork
- Churn causes remain mysterious
- Competitors with better quality steal customers
- Death by a thousand cuts
The Reality:Companies without robust quality monitoring don't suddenly fail—they slowly lose ground to competitors who understand and optimize their customer experience.
In today's market, not monitoring quality is not a neutral choice—it's a competitive disadvantage.
Quality Monitoring Methods & Approaches
There are multiple methodologies for conducting quality monitoring. Understanding each helps you choose the right approach for your situation.
Method 1: Manual Sampling
How It Works:
- QA team manually selects a sample of interactions
- Evaluators listen/read and score using scorecards
- Feedback provided to agents and managers
Sampling Strategies:
- Random Sampling: Select interactions at random
- Stratified Sampling: Ensure representation across segments (agent, time, issue type)
- Targeted Sampling: Focus on specific scenarios (complaints, new agents, high-value customers)
Pros:
- ✅ Human judgment and nuance
- ✅ Can catch contextual subtleties
- ✅ No technology investment required
- ✅ Familiar methodology
Cons:
- ❌ Limited coverage (typically 2-5%)
- ❌ Time-intensive and expensive
- ❌ Evaluator inconsistency
- ❌ Selection bias
- ❌ Doesn't scale
Best For:
- Very small teams (<10 agents)
- Highly nuanced/complex interactions
- Organizations with large QA budgets
Method 2: Side-by-Side Monitoring
How It Works:
- Supervisor/coach listens to live calls alongside agent
- Real-time feedback and coaching
- Often used for training new agents
Pros:
- ✅ Immediate feedback
- ✅ Contextual understanding
- ✅ Teachable moments in real-time
- ✅ Builds relationships
Cons:
- ❌ Extremely time-intensive
- ❌ Not scalable beyond onboarding
- ❌ Can be intimidating for agents
- ❌ Limited documentation
Best For:
- New agent training
- Mentorship programs
- Handling highly complex situations
Method 3: Agent Self-Assessment
How It Works:
- Agents evaluate their own performance
- Compare self-assessment to manager assessment
- Promotes self-awareness and reflection
Pros:
- ✅ Develops agent self-awareness
- ✅ Engages agents in quality process
- ✅ Reduces defensiveness
- ✅ Identifies perception gaps
Cons:
- ❌ Can't be sole quality method
- ❌ Potential for grade inflation
- ❌ Time-consuming for agents
- ❌ Doesn't provide objective data
Best For:
- Complement to other methods
- Development-focused cultures
- Mature quality programs
Method 4: Peer Review
How It Works:
- Agents evaluate each other's interactions
- Calibration sessions ensure consistency
- Creates shared ownership of quality
Pros:
- ✅ Builds quality culture
- ✅ Peer learning opportunities
- ✅ Distributes evaluation workload
- ✅ Increases buy-in
Cons:
- ❌ Potential for conflicts
- ❌ Inconsistency without strong calibration
- ❌ Takes agents away from customer work
- ❌ May lack manager oversight
Best For:
- Strong team cultures
- Ongoing development
- Supplement to formal QM
Method 5: Customer Feedback Integration
How It Works:
- Link quality scores to customer satisfaction surveys
- Use CSAT/NPS as quality indicators
- Investigate interactions with poor customer feedback
Pros:
- ✅ Direct customer voice
- ✅ Outcome-focused
- ✅ Validates quality criteria
- ✅ Identifies gaps
Cons:
- ❌ Low survey response rates (typically 5-15%)
- ❌ Lagging indicator (after-the-fact)
- ❌ Response bias
- ❌ Doesn't explain why
Best For:
- Validating quality frameworks
- Prioritizing evaluation focus
- Executive reporting
Method 6: Automated Speech/Text Analytics
How It Works:
- Software analyzes 100% of calls using speech recognition
- Text analytics for email/chat
- Identifies keywords, phrases, sentiment
Pros:
- ✅ 100% coverage
- ✅ Consistent analysis
- ✅ Fast insights
- ✅ Pattern detection
Cons:
- ❌ Limited to keyword/phrase detection
- ❌ Lacks deep contextual understanding
- ❌ May miss nuance
- ❌ Setup and tuning required
Best For:
- Compliance monitoring (did agent say required phrases?)
- Trend identification
- Supplement to manual review
Method 7: AI-Powered Quality Monitoring
How It Works:
- Advanced NLP analyzes 100% of interactions
- Custom criteria defined as prompts
- AI scores based on your specific quality definition
- Real-time or near-real-time feedback
Pros:
- ✅ 100% interaction coverage
- ✅ Consistent, objective evaluation
- ✅ Customizable to your criteria
- ✅ Scales effortlessly
- ✅ Fast insights and feedback
- ✅ Pattern detection across massive datasets
- ✅ Multi-language support
Cons:
- ⚠️ Technology investment required
- ⚠️ Requires quality training data
- ⚠️ Need clear criteria definition
- ⚠️ Change management for adoption
Best For:
- Modern support teams (50+ agents)
- Multi-channel environments
- Organizations prioritizing data-driven decisions
- Companies scaling rapidly
Hybrid Approaches
The Reality:Most effective quality programs combine multiple methods.
Example Hybrid Framework:
- AI monitors 100% of interactions for consistency and coverage
- Manual spot-checks of flagged interactions for nuance
- Agent self-assessment quarterly for development
- Customer feedback validates quality impact
- Peer reviews for team building and shared learning
Why Hybrid Works:
- Balances automation efficiency with human judgment
- Provides multiple data sources for triangulation
- Engages different stakeholders
- Reduces single-method limitations
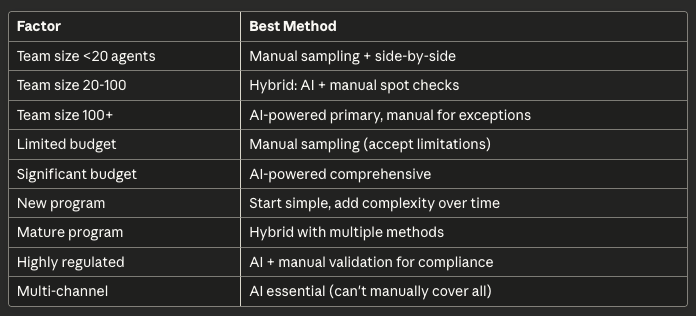
Choosing Your Method
Consider:
Building Your Quality Monitoring Framework
A quality monitoring framework is your foundation—the structure that defines what you measure, how you measure it, and why.
Step 1: Define Quality for Your Business
The Challenge:"Quality" means different things to different organizations. Without a clear definition, you can't measure it.
The Questions to Answer:
- What does an "excellent" customer interaction look like for us?
- What behaviors or outcomes define quality in our context?
- What matters most to our customers?
- What aligns with our brand values?
Exercise: Quality Workshop
Gather stakeholders (CX leaders, operations, training, frontline agents) and complete:
A. Identify Quality Dimensions
Brainstorm categories that matter. Common dimensions include:
- Problem Resolution: Did we solve the customer's issue?
- Efficiency: Was it resolved quickly?
- Empathy: Did the customer feel heard and understood?
- Professionalism: Was the interaction courteous and appropriate?
- Knowledge: Did the agent demonstrate expertise?
- Communication: Was the explanation clear?
- Compliance: Were required procedures followed?
- Effort: How easy was it for the customer?
B. Prioritize
Vote on which dimensions matter most. Force ranking exercise:
- If you could only measure 3 things, what would they be?
- What most impacts our customer satisfaction scores?
- What aligns with our company values?
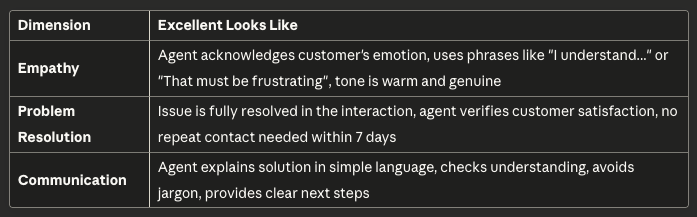
C. Define Excellence
For each priority dimension, describe what "excellent" looks like with specific, observable behaviors.
Example:
Step 2: Create Your Quality Criteria
Transform your quality dimensions into measurable criteria.
Criteria Characteristics:
Good quality criteria are:
- ✅ Specific: No ambiguity in what's being measured
- ✅ Observable: Can be identified in the interaction
- ✅ Measurable: Can be scored consistently
- ✅ Relevant: Impacts customer experience or business outcomes
- ✅ Actionable: Agent can improve through coaching
Criteria Types:
1. Binary (Yes/No)
Best for: Required behaviors, compliance items
Examples:
- Did the agent introduce themselves by name?
- Did the agent offer to follow up?
- Did the agent mention the required disclaimer?
2. Scalar (0-10 or 1-5)
Best for: Qualitative judgments requiring nuance
Examples:
- How empathetic was the agent? (0-10)
- How clear was the explanation? (1-5)
- How professional was the tone? (0-10)
3. Categorical (Labels)
Best for: Classification into quality levels
Examples:
- Agent's tone: Excellent / Good / Acceptable / Poor
- Problem complexity: Simple / Moderate / Complex
- Outcome: Fully resolved / Partially resolved / Unresolved
Number of Criteria:
Start simple: 5-7 criteriaMature programs: 10-15 criteriaAvoid: 20+ criteria (creates evaluation fatigue)
Example Starter Scorecard:
- Agent identified themselves (Yes/No) - 5 points
- Agent demonstrated empathy (0-10) - 20 points
- Agent provided clear solution (Yes/No) - 25 points
- Agent verified customer understanding (Yes/No) - 15 points
- Professional tone maintained (Label) - 15 points
- Issue fully resolved (Yes/No) - 20 points
Total: 100 points
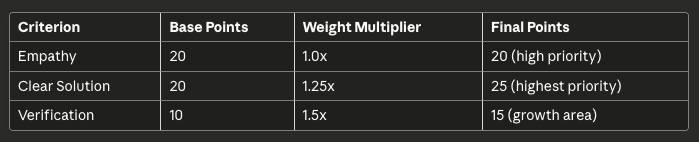
Step 3: Weight Your Criteria
Not all criteria have equal impact. Weight them accordingly.
Weighting Methods:
A. Business Impact
- Correlate each criterion with CSAT/NPS
- Weight criteria that most predict satisfaction
B. Strategic Priority
- Align weights with company values
- Example: If empathy is core brand value, weight it highest
C. Common Failure Points
- Weight criteria where team struggles most
- Focuses improvement efforts
Example:
Step 4: Set Scoring Thresholds
Define what scores mean in terms of performance levels.
Example Scoring Bands:
- 90-100: Excellent (top 20% of agents)
- 75-89: Good (meets all standards)
- 60-74: Needs Improvement (some gaps)
- <60: Unacceptable (immediate intervention)
Calibration:
Before rolling out:
- Have multiple evaluators score the same 10-20 interactions
- Compare scores and discuss differences
- Refine criteria definitions until consistency achieved
- Target: <10 point variation between evaluators
Step 5: Document Your Framework
Create a Quality Monitoring Playbook that includes:
Section 1: Philosophy
- Your quality definition
- Why quality monitoring matters
- How it will be used (development, not punishment)
Section 2: Criteria
- Full scorecard with descriptions
- Examples of each score level
- Weighting rationale
Section 3: Process
- How interactions are selected/analyzed
- Evaluation cadence
- Feedback process
- Appeal/dispute procedure
Section 4: Roles & Responsibilities
- Who evaluates
- Who reviews
- Who coaches
- Escalation paths
Section 5: Continuous Improvement
- How criteria will be reviewed
- Feedback mechanisms
- Update process
Make it accessible:
- Share with all agents
- Include in onboarding


